| A steady stream of negative data confirms slowing activity in the U.S. housing market, compelling MRP to add Short US Housing as a theme.
Given rising mortgage rates, skyrocketing building costs, tight inventories, and overheating home prices, it is only a matter of time before the U.S. housing recovery that Joe McAlinden identified in the Spring of 2012 comes to a halt. In fact, a steady stream of negative data confirms that activity in the housing market is already slowing.
1. Declining Builder Sentiment
Each month, the National Association of Homebuilders (NAHB) surveys its members about current housing conditions. The responses are then tallied into an index that tracks builder sentiment. This sentiment index is closely watched for clues on whether builders will start more housing projects. A reading above 50 indicates that homebuilders rate current conditions as good or fair. After rising for several years, the trendline for the NAHB confidence index has recently reversed course. While the current index level of 67 is considered still “solid,” by the industry group, it is now almost 10% below the cycle high of 74 reached in December, and a full point below the full-year average for 2017.
2. Declining Buyer Traffic
Last month, the Realtor Buyer Traffic Index published by the National Association of Realtors (NAR) slid to 57, a 17% drop from the August 2017 reading of 69. In fact, the Buyer Traffic Index declined in 38 out of 50 states during the period June to August 2018, compared to June to August 2017. Buyer traffic has a strong correlation with future contracts and home sales, so it can be viewed as a peek ahead at sales trends two to three months into the future. So, while the traffic score is still above the baseline 50, the downward trend reflects softening buyer demand. Similary, Credit Suisse’s own monthly survey of real-estate agents revealed that national buyer traffic declined last month and is now 1 point below the long-term average for August.
3. Declining Home Sales
U.S. homes sales have been wobbly of late and, last month, inventory increased for the first time in three years.
Sales of new U.S. single family homes sank to a 9-month low in July, and while there was a slight rebound in August, the underlying trend points to a weakening housing market. Sales of previously-owned homes fell in August from a year earlier, marking six consecutive months of decline. Meanwhile, pending home sales have decreased for 8 straight months on an annual basis. The Pending Home Sales Index (PHS) measures housing contract activity and is based on signed real estate contracts for existing single-family homes, condos, and co-ops. Because a home goes under contract 1-2 months before it is sold, the Pending Home Sales Index generally leads Existing-Home Sales by a month or two.
Even international sales are falling. The dollar volume of U.S. homes sold to international buyers between April 2017 and March 2018 dropped 21% YoY. Sales to Canadian buyers, who had been the market leaders by far during the recession, fell by a whopping 45%.
Evidence of shrinking mortgage applications also lends support to the case that sales are weakening.
4. Declining Affordability
The primary reason sales have been hampered this year is due to the very lean supply of affordable listings. Years of underbuilding have left a gap of 6 million unitsin the housing stock. Consequently, buyer demand has far exceeded the housing supply available for sale, pushing home prices up by an average of 6.2% annually since 2012. The Case-Shiller Home Price Index, which tracks the value of homes in key markets across the United States, is now at record levels.
Meanwhile, U.S. mortgage rates are on the rise, and just reached their highest level since April 2011. Last week, the average interest on a home loan hit 4.72% for a 30-year fixed rate mortgage, 4.16% for a 15-year fixed rate mortgage, and 3.97% for a 5-year adjustable rate mortgage. Compared to last year, that reflects gains of 89 basis points, 103 bps, and 77 bps, respectively.
With home prices increasing twice as fast as income, and mortgage rates rising, affordability is steadily declining. According to the NAHB priced-out model, for every $1,000 increase in the price of a home, about 150,000 households are priced out of the market for a median-priced new home. And, with each quarter-point increase in the rate on a 30-year fixed rate mortgage, as many as 1.2 million U.S. households will be priced out of the market for a median-priced new home.
Currently, housing affordability is at a 10-year low.
5. Declining Price Growth
U.S. home-sale prices increased 4.7% in August compared to a year ago. But, while home prices are still upward trending, the price growth rate has been dropping for six consecutive months and has not been this low since August 2014. Furthermore, the share of homes that sold above asking price declined from 25% last August to 23.6% this August. Nearly 30% of homes on the market in August had a price drop, the largest share on record since Redfin began tracking this metric in 2009.
6. Buy vs Rent Index Favors Renting
For the first time since 2010, it is now cheaper to rent a home than to be a homeowner in America. That shift is also confirmed by the Beracha, Hardin & Johnson Buy vs Rent Index (BH&J Index). Over the past year, the monthly costs of buying and owning a home that you occupy has risen 14%. That’s more than three times the 4% increase in rent rates nationally. Right now, the monthly aggregate housing cost to the average American homeowner is $587, compared to only $516 for renters. As the cost of ownership continues to outpace the cost of renting a like-kind property, it may take some time for the overall market to cross back into home ownership territory, especially given the current U.S. rental market glut. For the millions of millennials who are making the lifestyle decision of whether to buy or to rent, plunging homeownership affordability could tilt them further towards renting, which would hurt sales.
7. Homebuilder Margin Squeeze
Overly burdensome regulations and rising material costs exacerbated by an escalating trade skirmish, are already hurting builders’ margins, and analysts expect homebuilders to report slow or flat earnings growth next year. By some estimates, recent U.S. tariffs on China impose another tax on housing. About 600 of the nearly 6,000 products listed in the latest tariffs are either connected to home construction or to tools used to build apartments or homes. That represents $10 billion in goods, which at a 10% tariff rate puts a $1 billion tariff on housing.
There is no question that a tsunami of maturing millennials with improved employment and income prospects represent a powerful longer-term force for the U.S. housing market. But for now, there are enough structural headwinds to cause a decline in that market.
On May 21, 2018, after six years of being extremely bullish on the sector, MRP decided to close its Long US Housing theme. Today, we’re going a step further and adding Short US Housing as a new investment theme.
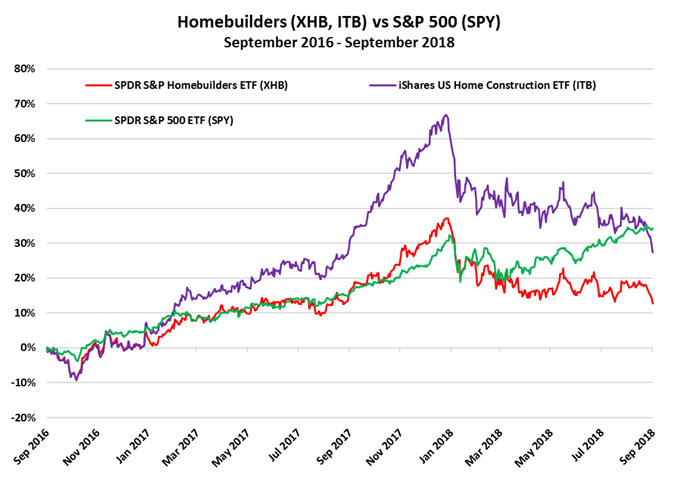
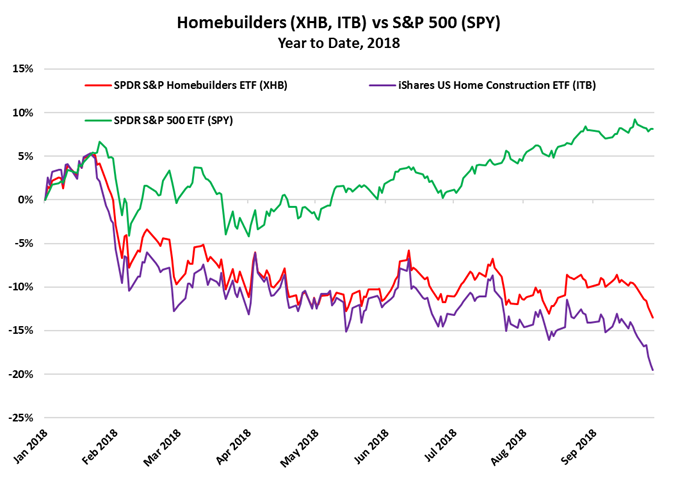
Homebuilder stocks are already having a tough year, as reflected by the iShares US Home Construction ETF (ITB) and the SPDR S&P Homebuilders ETF (XHB). The former is more of a pure play on homebuilder stocks while the latter offers exposure as well to the home furnishing side of the residential real estate trade. Ever since we closed our Long theme on May 21, ITB has fallen 8.5% and XHB has declined 3.5% while the S&P has climbed 6.3%. We believe there is further downside in the year ahead.
|