|
|
|
|
|
|
Daily Intelligence Briefing |
|
Thursday, October 10, 2019 |
|
|
Identifying Change-Driven Investment Themes - Five sections, explained here. |
|
|
|
|
I. Today's Thematic Investment Idea A deep dive into a market driver with alpha generating potential. |
Meet the Winners & Losers of the Global Natural Gas Glut → |
Summary: The natural gas glut has gone fully global. Prices in all the major markets are at historic lows; projections for the industry are bleaker than ever; there’s even talk of discouraging the upstream investments needed to maintain supply. The glut has created winners and losers. Today’s report uncovers who they are and how soon the market can flip from bust to boom. Read more + |
|
|
Source material for today's market insight... |
LNG: Natural-Gas Producers Hard Hit by Tanking Prices |
LNG: It’s “Feast-to-Famine” For The Global Gas Industry |
LNG: LNG investments hit record of $50 bln in 2019 -IEA chief |
LNG: LNG Buyers Fret Over Feast-or-Famine Forecasts |
LNG: Europe’s Natural Gas Glut Turns LNG Tankers Toward Asia |
LNG: Small Ships Are Next Big Thing for This $150 Billion Market |
|
|
|
|
|
II. Updates of Themes on MRP's Radar Follow-up analysis of key market drivers monitored by MRP. |
|
|
FX: Why central banks are edging away from the dollar |
Bonds: Greece joins club of negative-yielding debt issuers |
Cryptocurrencies: UNICEF launches Cryptocurrency Fund |
Banks: Banks and Economic Grievance in Russia |
Blockchain: Banking Giant UBS Goes Live on We.Trade Blockchain for Trade Finance |
Airlines SHORT: American Airlines cuts Boeing 737 Max from schedules until Jan. 16 as grounding continues |
World Economic Forum: U.S. Loses Top Spot to Singapore in Competitiveness Rankings |
|
|
|
|
|
|
|
|
IV. Active Thematic Ideas MRP's active long and short themes, with an archive of follow-up reports. |
See Them Here → |
|
|
|
|
V. Macroeconomic Indicators Key data releases relevant to MRP's Active Thematic Ideas. |
See Them Here → |
|
|
|
|
|
|
|
Meet the Winners & Losers of the Global Natural Gas Glut |
|
|
|
|
|
Summary: The natural gas glut has gone fully global. Prices in all the major markets are at historic lows; projections for the industry are bleaker than ever; there’s even talk of discouraging the upstream investments needed to maintain supply. The glut has created winners and losers. Today’s report uncovers who they are and how soon the market can flip from bust to boom. |
|
|
Global Natural Gas Prices Reach Historical Lows
The natural gas glut that originated in the United States has now gone fully global, dragging prices in various markets to historic lows. In the United States, the Henry Hub Natural Gas spot price has dropped 32% in one year to $2.36 per MMBtu, despite a surge in exports and record consumption among US power plants this summer. Prices in Asia have plummeted from $11 per MMBtu this time last year to below $4 per MMBtu today. Meanwhile, the European Union Natural Gas Import Price is now $4.20 MMBtu, down from last’s year’s $9.50 per MMBtu. These prices are well below the levels they were a decade ago.
In the absence of extreme weather conditions like the heatwaves of this summer or an especially chilly winter that could draw down stockpiles, gas prices are not likely to increase substantially anytime soon. That’s because, while demand is certainly rising, supply has been rising even faster, leading to a buildup in inventory that’s weighing on prices.
The U.S. Energy Information Administration (EIA) projects that gas production will rise 10% in 2019, backing up a 12% increase in 2018 – its biggest annual percentage output gain in nearly 70 years.
The Transformational Impact of the US Shale Boom
The global glut is being fueled by a shale gas boom in the United States, where some producers are unearthing the fuel as a byproduct of oil drilling. Indeed, America is so overflowing with natural gas that drillers in places like West Texas are having to burn it off.
US gas production rose to a record of more than 37 trillion cubic feet last year, up 44% from a decade earlier, and more than the country consumes. The EIA expects dry natural-gas production will average 91.6 billion cubic feet a day in 2019, a 10% increase from the 2018 average.
A lot of this excess gas is spilling over into global markets with US exports of the commodity at an all-time high. Domestic US stockpiles, meanwhile, keep rising and reached 3.317 trillion cubic feet at the end of September. That’s 16% higher than a year ago.
Swinging Market Pendelum
Economic projection for the gas industry have been so bleak of late that it seems as if the glut could continue for years and year. But economic and population expansion are the primary indicators of more energy demand. The United State, for instance, adds over 3 million people and some $300-400 billion in real GDP every year. By 2050, the world will have added nearly $85 trillion in real GDP and 2.5 billion people to surpass 10.2 billion humans. And in the medium term, there are simply too many industries switching to cheap gas for the oversupply to continue unabated indefinitely.
All this is to say that, sooner or later, gas demand will balance with supply and prices will stabilize. When that happens, gas E&P companies and their LNG counterparts should benefit from meeting the world's need of a fuel that is cleaner than oil or coal. Due to its abundance and lower carbon emissions, natural gas appears poised to supply a growing share of that demand, with LNG giving it the global access it needs to reach key market centers.
The rebalancing could happen within the next 24-36 months, which is sooner than many expect. The Wall Street Journal reports that rock-bottom gas prices and concerns about global economic growth are pushing companies to put off investments in the sector. The reduced investment could cause supply issues in the future. It takes years to plan for and build the facilities that liquify the commodity so that it can be transported to markets that need it.
Consider the fact that investment in LNG export facilities jumped after the 2011 Fukushima nuclear plant in Japan prompted many governments to look to natural gas as a substitute for nuclear power. The maximum impact of those investments is only now being felt, almost a decade later. This year, a record eight LNG projects are coming online, and that is contributing to the current supply glut.
The swing of the investment pendulum will be felt starting in 2021, when only one LNG project is estimated to start up. At that point, supplies could quickly tighten on unanticipated demand. If, say, governments decide to pursue a more aggressive carbon reduction program at the expense of coal and to the benefit of natural gas, the LNG surplus could easily flip into a shortage.
Losers of the LNG Glut
Until a rebound happens, the exploration-and-production companies that have flooded the market with cheap gas are caught between a rock and a hard place. If they dial back drilling plans to curtail output, they risk ceding market share to rivals in other parts of the country for whom natural gas is a byproduct of oil drilling. But if they don’t slow down, they will continue to swamp the market and risk pushing prices for their product lower. The more prices fall in the international market, the greater the risk that exporters – whose waterfront terminals produce the liquefied natural gas (LNG) that’s shipped overseas – will reduce their intake of gas. Rising exports are what have kept US domestic gas prices from collapsing completely this year.
In July, LNG exporters consumed an average of about 6 billion cubic feet of gas per day. That is the most yet and is equal to roughly 7% of total US gas production. Analysts expect demand from LNG facilities to absorb about 12% of total production by next summer as additional facilities start up and existing terminals boost their capacity. But if those projects are delayed because of low prices overseas or if existing LNG plants slow down or take advantage of the lull to perform extended maintenance, then the domestic gas market could be swamped, sending prices even lower.
The biggest losers of this glut are therefore natural gas producers like EQT Corp. (EQT), Gulfport Energy Corp. (GPOR), Range Resources Corp. (RRC), Antero Resources Corp. (AR), Chesapeak Energy (CHK) and Southwest Energy (SWN), as they are facing hard choices on all sides.
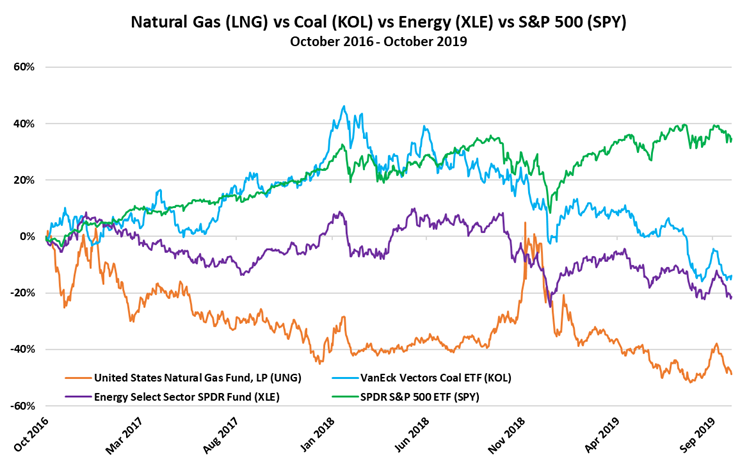
The share prices of all those companies have been hammered over the past 6 months, with each losing more than 50% of its value. Regardless of what timeframe you are looking at within the past three years, the stocks have also underperformed the commodity as represented by the United States Natural Gas Fund (UNG), an exchange-traded security that tracks the movements of natural gas prices.
The silver lining is that, given how far these stocks have fallen, they could bounce back just as hard when natural gas prices rebound in the future.
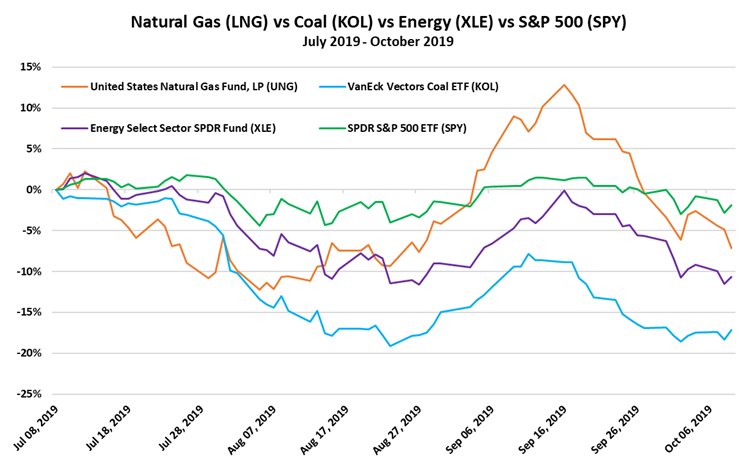
Coal producers are also losers during this natural gas glut. In Europe, for example, more utilities are switching from coal-to-gas to take advantage of crashing natural gas prices. Germany, the UK and Spain collectively burned 70% less coal in August compared to the same month in 2018. Coal stockpiles are surging as a result. The VanEck Vectors Coal ETF (KOL) invests in companies around the world that derive at least 50% of their revenues from the coal industry. Over the past 3 months, KOL has returned -17% versus –9% for UNG.
Winners of the LNG Glut
If natural gas producers are the losers in this current market, the winners are companies that are involved with storing, processing and even transporting the natural gas over to its end-use markets. These fall into the broad category of “LNG companies”.
LNG is natural gas in liquified form to facilitate transport of the commodity. At a liquefaction facility (aka “LNG terminal”), the gas is cooled down to -260 degrees Fahrenheit, at which point it transforms into a liquid and its volume shrinks 600 times. From there, the LNG flows into cryogenic storage tanks, which are designed to keep the gas cooled and in its liquid form. The LNG is then loaded onto a specialized gas-carrying vessel (aka “LNG carrier”) that transports it to market centers. When the LNG arrives at its final destination, it goes through a regasification process at an import facility where heat exchangers transform the liquid back into a gas so that it can flow through local pipelines.
The dramatic rise in US natural gas exports – the same one causing the global glut – is benefitting three types of companies involved in the LNG process. These are the equipment manufacturers, LNG terminal operators, and LNG tankers / shhipping carriers. One company in each of these categories is mentioned below as an example.
The equipment manufacturer: Chart Industries (GTLS) makes equipment used in the production, storage and transportation of natural gas. For example, Chart Industries makes LNG fuel tanks and systems for heavy trucks. It is one of largest suppliers to the burgeoning LNG ecosystem in North America.
The terminal operator: Cheniere Energy (LNG) is engaged primarily in the business of building and then operating LNG terminals. The company launched its LNG business in 2012 and has invested $23 billion to build terminals across the US Gulf Coast to export America’s growing supply of natural gas. Cheniere converts the natural gas into liquified form at its LNG facilities and then ships the bulk of that gas to major buyers around the world.
With an LNG terminal, customers in top importing countries like Japan, China or South Korea can take shipments from any of the countries that produce the fuel -- a group as far flung as Australia, the United States, Algeria, Angola, Qatar and Russia. These buyers are typically under long-term contracts, thus providing Cheniere with predictable cash flow. Most of Cheniere’s LNG terminals will be operational by next year, giving the company the capacity to produce 40.5 million tons per year (mtpa) of LNG. That would rank Cheniere among the five largest global suppliers of LNG.
The shipping carrier: GasLog Ltd. (GLOG) is an owner operator and manager of liquefied natural gas (LNG) carriers. Considred a "pure play" LNG shipper, GasLog provides support to international energy companies as part of their LNG logistics chain. |
|
|
|
|
|
Natural Gas vs Coal vs Energy vs S&P 500 |
|
|
|
|
|
|
Source material for today's market insight... |
|
|
LNG Natural-Gas Producers Hard Hit by Tanking Prices
It is going to take a heck of a winter to ease the pain for natural-gas investors and producers. Dragged down by a supply glut, U.S. natural-gas futures recently suffered their longest losing streak since at least 1990. The front-month gas futures contract fell 12 consecutive trading sessions through Oct. 2, a period in which it declined around 16%. Prices are down 30% from their levels a year ago.
Natural-gas futures for November delivery lost 0.7% to settle at $2.288 per million British thermal units Tuesday. Analysts with Tudor, Pickering, Holt & Co., an energy focused investment bank, warned clients recently that gas might fall below $2 per million British thermal units before prices hit a floor.
That has created an existential dilemma for companies that rely on gas sales, such as those that drill in Appalachia, the country’s most prolific gas field. If they slow output, they risk ceding market share to rivals in other parts of the country for whom natural gas is a byproduct of oil drilling. But if they don’t slow down, they will continue to swamp the market and risk pushing prices for their product lower.
The decline in natural-gas prices has hammered shares of Appalachian producers in recent years. Shares of Gulfport Energy Corp. (GPOR), Range Resources Corp. (RRC), EQT Corp. (EQT) and Antero Resource (AR) have all lost more than half of their stock-market value this year.
Despite these companies dialing back drilling plans and spending at the urging of investors, their output continues to grow. The EIA estimates that Appalachian natural-gas production will reach a record this month. The latest data puts total gas in storage at 3.317 trillion cubic feet, 16% above levels a year ago.
Read the full article from The Wall Street Journal + |
|
|
LNG It’s “Feast-to-Famine” For The Global Gas Industry
A surplus of gas means that LNG prices in various markets are languishing at their lowest levels in a decade. Spot prices in Asia fell below $5/MMBtu, down by two-thirds from price levels seen just a few years ago.
And the substantial shift away from coal and into gas in Europe is not enough to soak up the surplus. Europe coal stockpiles are surging as utilities switch to gas, taking advantage of rock-bottom prices. Germany, the UK and Spain collectively burned 70 percent less coal in August compared to the same month in 2018.
Meanwhile, China’s appetite for LNG is cooling. Demand for LNG in China may only rise 14 percent this year. That is still a significant number, but below historical growth rates and ultimately a disappointment to LNG shippers everywhere, many of which are banking on insatiable Chinese demand.
The supply/demand balance looks pretty frightening at least for the next few years. “[W]e forecast Asian LNG demand growth of 15mmtpa and global growth of just 8mmtpa YoY in 2020, and the weakening macro outlook presents downside risk to our forecast,” Bank of America said. “Against this backdrop, the US continues to lead an estimated global LNG supply growth ramp up of 40 mtpa in the next two years.”
While the market may turn more favorable to gas producers and exporters in several years’ time, the industry then faces the prospect of losing competitiveness to renewable energy. By 2035, many gas-fired power plants risk becoming stranded assets.
Read the full article from Oil Price + |
|
|
LNG LNG investments hit record of $50 bln in 2019 -IEA chief
Record investments of $50 billion have turned 2019 into a banner year for liquefied natural gas, with Canada and the United States being the main drivers, the chief of the International Energy Agency said.
While growth of LNG imports by Japan and Korea are expected to stay important, slowing growth there means the biggest contribution will be from China which is expected to overtake Japan as the world’s top importer of the fuel in five years. Other Asian nations, such as Bangladesh, India, Pakistan, Thailand are also importing more LNG.
The United States will make up two-thirds of global growth in LNG exports, which could turn pricing dynamics in Asia towards more gas-linked, rather than oil-linked LNG contracts, he said. About 70 percent of LNG contracts are oil-indexed, with the rest geared to gas. That could soon change to a 50-50 pricing mix.
Read the full article from CNBC + |
|
|
LNG LNG Buyers Fret Over Feast-or-Famine Forecasts
Big Asian consumers of liquefied natural gas are enjoying low prices now but fear a boom-and-bust cycle could hurt them by discouraging investment in projects needed to maintain supply.
Japan is the world’s top importer of LNG. China and South Korea are also major importers. Investment in LNG export facilities grew after 2011 as Japan increasingly turned to the fuel following the accident at the Fukushima nuclear plant.
It takes years to plan for and build the facilities, so the maximum impact is only now being felt. This year, a record eight projects are coming online, and that is contributing to a supply glut. The swing of the investment pendulum will be felt starting in 2021, when only one LNG project is estimated to start up. That is set to grow to three in 2022 before falling back again to one in 2023, according to Wood Mackenzie.
Supplies could turn tight depending on demand from China, which by some estimates is poised to overtake Japan as the top LNG importer over the next decade. If China pursues a reduction of carbon emissions more aggressively, it is likely to turn to natural gas to fuel power plants in place of coal.
Still, investors today are continuing to put off final investment decisions because of uncertainty about the global economic outlook and stiff competition, said Peter Lee, an oil and gas analyst at Fitch Solutions. If the current trend continues, he said, a shortage of LNG may appear in the region starting in 2022.
Read the full article from The Wall Street Journal + |
|
|
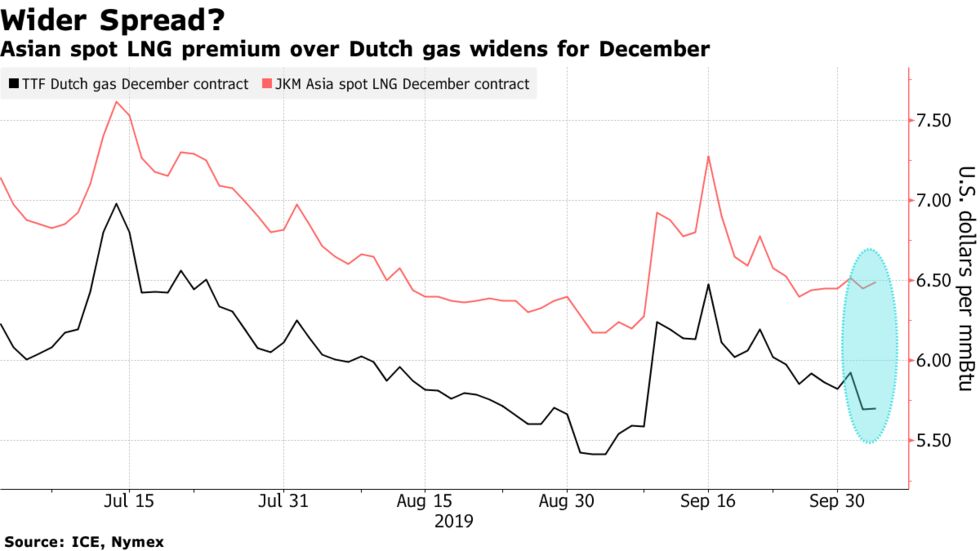
LNG Europe’s Natural Gas Glut Turns LNG Tankers Toward Asia
At least seven tankers that loaded over the past two months, mainly in the U.S., have diverted away from Europe in search of new markets because there’s not enough room to park the fuel while traders await higher prices.
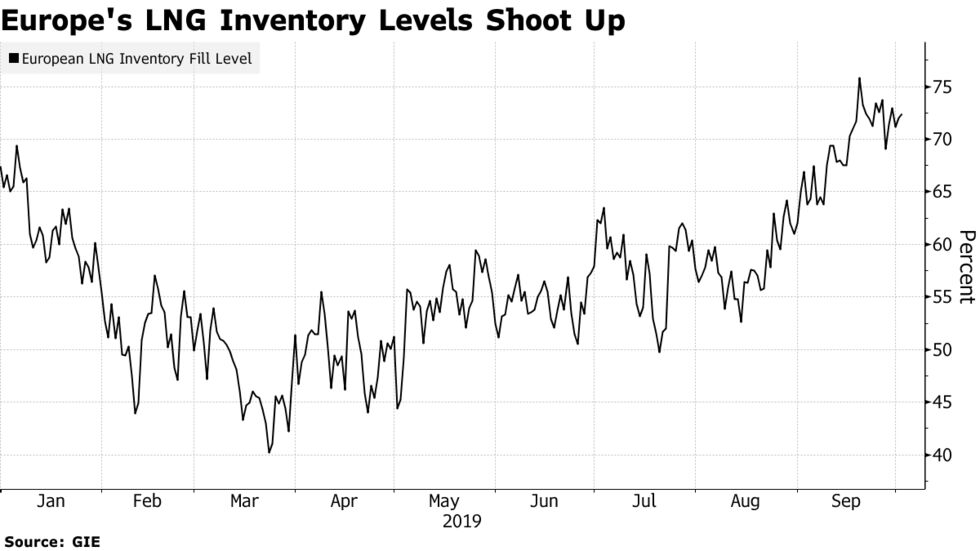
The lack of space in storage terminals means some gas sellers won’t be able to benefit from the usual seasonal price increase and instead must seek other customers, which may be a boon for buyers in Asia.
Spanish LNG facilities in particular have received a record numbers of cargoes recently as traders took advantage of the nation’s six terminals, the most in any European nation. They poured gas into the tanks when prices were low and supply was booming from new plants in the U.S. The aim was to take advantage of higher prices months later when the heating season kicked in. Now, the Spanish terminals are so full that only scheduled shipments will be serviced.
Read the full article from Bloomberg + |
 |
 |
|
|
LNG Small Ships Are Next Big Thing for This $150 Billion Market
Giant ocean-going tankers built the liquefied natural gas industry into a $150-billion-a-year business. Fifty-five years after the first commercial LNG tanker sailed from Algeria, this segment of the gas industry is pushing into ever more niche markets, upending the economics of energy supply in the process.
Its next leap forward will be serving customers whose ports or budgets are too small to handle regular LNG tankers. Known as small-scale LNG, the idea is to make the fuel chilled to minus 160-degrees Celsius (256 Fahrenheit) accessible to factories, trucks, ships and even households. That’s set to spur production capacity growth of 58% over the next five years, more than double the pace of the industry in total.
The International Gas Union classifies a small-scale LNG vessel as one with capacity under 30,000 cubic meters. That’s about 1/7th of the biggest tankers and they can help LNG reach a growing number of buyers that only need a fraction of the cargo that a regular tanker can carry.
Global small-scale production is about 25 million tons per year. That’s a tiny part of the entire LNG industry, which handled more than 300 million tons last year. Still, the small-scale end of the business may grow 6% a year. That’s caught the eye of some of the leading LNG producers. Qatar Petroleum and Royal Dutch Shell Plc and others are considering investments on the small-scale side of the industry.
OMV AG and the Italian pipeline operator Snam SpA may build a small-scale liquefaction plant in Austria to meet demand for LNG-powered trucks. Facilities for serving ferries are operating in Norway and gas-burning vessels are entering cruise ship fleets. New Fortress Energy LLC plans to sell LNG across the Caribbean, Central America and West Africa and is already shipping the fuel to Jamaica. Avenir LNG Ltd., with six vessels and an LNG import terminal in Sardinia under construction, is also looking to build in Scotland, the South Pacific and Latin America.
One big source of small-scale LNG will be from shipping as stricter regulations by the International Marine Organization on the sulfur content of marine fuel kick in from next year. LNG is one of the alternatives to replace dirtier oil product-based fuels.
Read the full article from Bloomberg + |
|
|
|
|
|
|
|
|
Select a theme to see when and why we added it. Also included is a link to all recent Market Insight reports we've written about that theme, allowing you to track its progress. |
|
|
|
|
|
|
|
|
US Job Openings Fall to 1-1/2-Year Low
The number of job openings fell to 7.051 million in August 2019 from a downwardly revised 7.174 million in the previous month and below market expectations of 7.191 million. It was the lowest level since March 2018, mainly driven by a decline in the Midwest region (-183,000). Job openings decreased in nondurable goods manufacturing (-49,000) and in information (-47,000). Meanwhile, hiring dropped by 199,000 to 5.779 million in August, due to decreases in the private sector.
Click here to access the data + |
|
|
|
|
Japan Producer Prices Fall Further
The Producer Price Index of Japan declined by 1.1% year-on-year in September 2019, following a 0.9% drop in the previous month. This was the biggest yearly decrease in producer prices since December 2016 and comes amid trade tensions and increasing speculation of further monetary stimulus. On a monthly basis, producer prices were flat after a 0.3 percent decline in August. In September, prices fell further for oil (-11.9% vs -9.9% in August) and chemicals (-4.8% vs - 4.7%). Also, non-ferrous metal prices continued to decline but at a softer pace of 4.8% (vs -5.3%).
Click here to access the data + |
|
|
|
|
Dutch Manufacturing Output Falls for 6th Month
The average daily output generated by the Dutch manufacturing industry dropped 0.8% year-on-year in August 2019, after an upwardly revised 0.4% fall in the previous month. It was the sixth straight monthly decline in manufacturing output, as production fell further for: rubber & plastic products (-5.0 percent vs -2.8 percent); chemical products (-8.1 percent vs -5.9 percent); machinery (-1.3 percent vs -6.0 percent); and metal output (-0.6 percent vs -2.9 percent).
Click here to access the data + |
|
|
|
|
Philippines Trade Gap Narrows in August, Exports Rise for 5th Month
The Philippine's trade deficit narrowed to USD 3.41 billion in August of 2019 from USD 3.60 billion in the same month a year earlier, as exports rose 0.6% year-on-year while imports tumbled 11.8%. Considering the first eight months of the year, exports edged up 0.1% from a year earlier while imports declined 2.8%, recording a USD 24.70 billion trade gap.
It was the fifth straight month of increase in exports, but the smallest growth, as sales advanced for gold (93.2%), ignition wiring set and other wiring sets used in vehicles, aircraft and ships (7.6%). Also, sales of electronics, the country's top exports, rose by 6.6 percent.
Among the Philippines' major trading partners sales advanced to the US (7.0%), China (1.6%), South Korea (38.7%). Conversely, exports contracted to Japan (-2.9%), the EU countries (-3.2%). and the ASEAN countries (-5.4%).
Click here to access the data + |
|
|
|
|
Soybeans Prices Rise To Over 1-Year High
Soybeans prices jumped 1% to $9.27 a bushel on Wednesday, the highest level since June 2018, as forecasts for a snowstorm in the US Midwest key production region threatened supplies. Prices were also supported by renewed optimism regarding the trade talks between the world´s two biggest economies after Beijing offered to increased purchases of US agricultural products.
Click here to access the data + |
|
|
|
|
Commodities: Cotton +1.92%, Ethanol -1.20%
Top commodity gainers are Cotton (1.92%) and Silver (0.74%). Biggest losers are Ethanol (-1.20%) and Gasoline (-0.42%).
Click here to access the data + |
|
|
|
|
MARKET INSIGHT UPDATES: SUMMARIES |
|
|
|
|
FX Why central banks are edging away from the dollar
The US dollar has long towered over global markets and finance. But cracks are starting to appear in the edifice. In last month’s quarterly report on central banks’ reserves, the IMF said that the share of the global total denominated in dollars was just short of 62% in the second quarter of this year, down 0.76 percentage points from the same period a year earlier. Euro-denominated reserves account for 20%.
While the dip is small, the apparent resilience is deceptive. The dollar was, during that quarter, the highest-yielding currency in the developed world. In theory, that should have lured in investment at a faster pace than other currencies, opines Alan Ruskin, chief international strategist at Deutsche Bank in New York.
Instead, central bank reserve managers — a powerful force in global markets — accumulated 3.5% more dollars over the year, far behind gains of 17% for the renminbi and even 8% for sterling, despite the pound’s Brexit-related troubles.
Goldman Sachs analysts said that dollar reserves slipped nearly four percentage points over 2017 and 2018. At the same time, reserve managers have continued to add to their renminbi and Japanese yen holdings, especially in countries that have had a fractious political relationship with the US.
The dollar’s falling share of reserves represents an “official sector vote against US ‘exceptionalism’”, said Mr Ruskin. In his view, the data should give pause to US policymakers contemplating laws to tax foreign purchases of US assets, further sanctions based on the international use of the dollar and plans to restrict access to US capital markets. All are actions that could weaken the dollar’s influence.
But central banks face a tough choice. Neither the euro nor the renminbi have the deep liquidity that dollar markets offer. Yields on eurozone government bonds are deeply negative while the renminbi remains tightly controlled by the Chinese government.
Some reserve managers have turned to gold. Central banks have been buying the yellow metal at levels last seen during the Bretton Woods era, when exchange rates were pegged to gold. China, Russia and India were the largest buyers of gold alongside Turkey and Kazakhstan. China alone has added almost 100 tonnes of gold to its reserves over the past 10 months.
Read the full article from The Financial Times + |
 |
 |
|
|
Bonds Greece joins club of negative-yielding debt issuers
The Greek government on Wednesday sold new three-month debt at a yield of minus 0.02 per cent, meaning buyers were prepared to lock in a loss on their investment. The sale establishes a new frontier for sub-zero bond yields and caps Greece’s extraordinary rehabilitation in the eyes of investors having received multiple bailouts during the region’s debt crisis.
The decline partly reflects the fact that the European Central Bank cut interest rates by 0.1 percentage point to minus 0.5 per cent in September. But the milestone is also a sign that investors have grown more confident about the prospects for the Greek economy, which is forecast to grow at 2.8 per cent next year.
With the ECB also announcing the resumption of its bond-buying stimulus programme last month, markets are awash with cash hungry for the relatively high yield that Greek debt offers. Around two-thirds of the government debt in the euro area currently trades at a negative yield, including all German bonds.
Other former crisis spots like Italy and Spain have already joined the negative-yield club, with Madrid being paid to borrow to maturities of up to nearly a decade. The yield on Portugal’s benchmark 10-year debt has also dropped below that of Spain in recent days, a rare occurrence since the Iberian neighbours became eurozone members.
Read the full article from The Financial Times + |
|
|
Cryptocurrencies UNICEF launches Cryptocurrency Fund
UNICEF will now be able to receive, hold and disburse donations of cryptocurrencies ether and bitcoin, through its newly-established UNICEF Cryptocurrency Fund. In a first for United Nations organizations, UNICEF will use cryptocurrencies to fund open source technology benefiting children and young people around the world.
Under the structure of the UNICEF Cryptocurrency Fund, contributions will be held in their cryptocurrency of contribution, and granted out in the same cryptocurrency.
The first contributions to the UNICEF Cryptocurrency Fund will be received from the Ethereum Foundation and will benefit three grantees of the UNICEF Innovation Fund – and a project coordinated by the GIGA initiative to connect schools across the world to the internet.
The launch of the Cryptocurrency Fund is part of UNICEF’s ongoing work with blockchain technology. UNICEF co-leads the UN Innovation Network with WFP. The network is responsible for researching the potential and pitfalls of blockchain and other emerging technologies.
Read the full article from UNICEF + |
|
|
|
|
|
|
Banks Banks and Economic Grievance in Russia
Patterns of unusually high online interest in Russia’s financial sector could be reflecting concerns about the health of the country’s banks. Russia’s economy has been slowing, with the central bank recently lowering its 2019 growth forecast from 1%-1.5% to 0.8%-1.3%.
The government insists a recession is not forthcoming. Yet this summer, the World Bank warned that despite government bailouts for troubled lenders totaling tens of billions of dollars, Russia’s banks remained at risk of systemic failures.
Online interest in Russia’s banks has been steadily rising since early September and last week hit its highest level of the year.
Read the full article from PreData+ |
 |
 |
|
|
|
|
|
|
Blockchain Banking Giant UBS Goes Live on We.Trade Blockchain for Trade Finance
Swiss financial giant UBS has started full-fledged transactions on we.trade, a blockchain-based trade finance platform that’s nearing wide adoption by its member banks. Société Générale, HSBC, Santander, UniCredit, Nordea, KBC Bank, Rabobank, and Deutsche Bank already use we.trade to settle trade contracts.
Blockchains offer a shared digital record to the previously paper-based world of global trade and help reinforce trust between companies executing trade agreements. We.trade focuses on creating a trusted network among the SME clients of European banks. Services include bank payment guarantees and invoice financing, for which the banks charge a fee.
Launched in mid-2018, we.trade is ahead of rivals like Marco Polo, a trade finance blockchain backed by TradeIX and R3 that’s still in the pilot stage. The we.trade platform is now all about commercial adoption and it’s taking a two-pronged approach: attract more banks and onboard more SMEs.
Erste Group of Austria and Spain’s CaixaBank also started pushing through on live transactions this month. And early next year, Eurobank of Greece and the three main banks of the Czech Republic — CSOB, Komercni, and Česká Spořitelna — are set to join them. The three Czech banks account for 80 percent of domestic trade in that country.
We.trade plans to add a new feature to its software allowing clients to invite their partners to its platform. For example, a Swedish company that banks with Nordea and imports limited edition sneakers can ask its supplier in Spain to open a business account with Santander so it could sign up to we.trade.
The we.trade platform is built by IBM on the open-source Hyperledger Fabric blockchain system.
Read the full article from Coindesk + |
|
|
|
|
|
|
Airlines American Airlines cuts Boeing 737 Max from schedules until Jan. 16 as grounding continues
American Airlines pulled the Boeing 737 Max from its schedules until mid-January, as the prolonged grounding of the troubled plane disrupts year-end holiday travel. Southwest Airlines struck the planes from its schedules until Jan. 5, while United Airlines expects them back Dec. 19.
The schedule change will force American to cancel around 140 flights a day. The airline previously expected the planes to return to its fleet for commercial service in early December, and like other carriers, has had to repeatedly postpone the jet’s return to its schedules.
Regulators have not said when they will allow airlines to operate the Max jet again. The plane hasn’t been allowed to fly since mid-March after two crashes within five months of each other killed 346 people.
The grounding has forced airlines to cancel thousands of flights, driven up costs and dented airlines’ profits. American said Wednesday that the 9,475 flights it canceled in the third quarter reduced its pretax income in the period by about $140 million.
Airline executives are talking with Boeing about receiving compensation for the grounding, the largest ever. Boeing took a $4.9 billion after-tax charge in the second quarter to reimburse losses at carriers that can’t fly the fuel-efficient planes.
Read the full article from CNBC + |
|
|
|
|
|
|
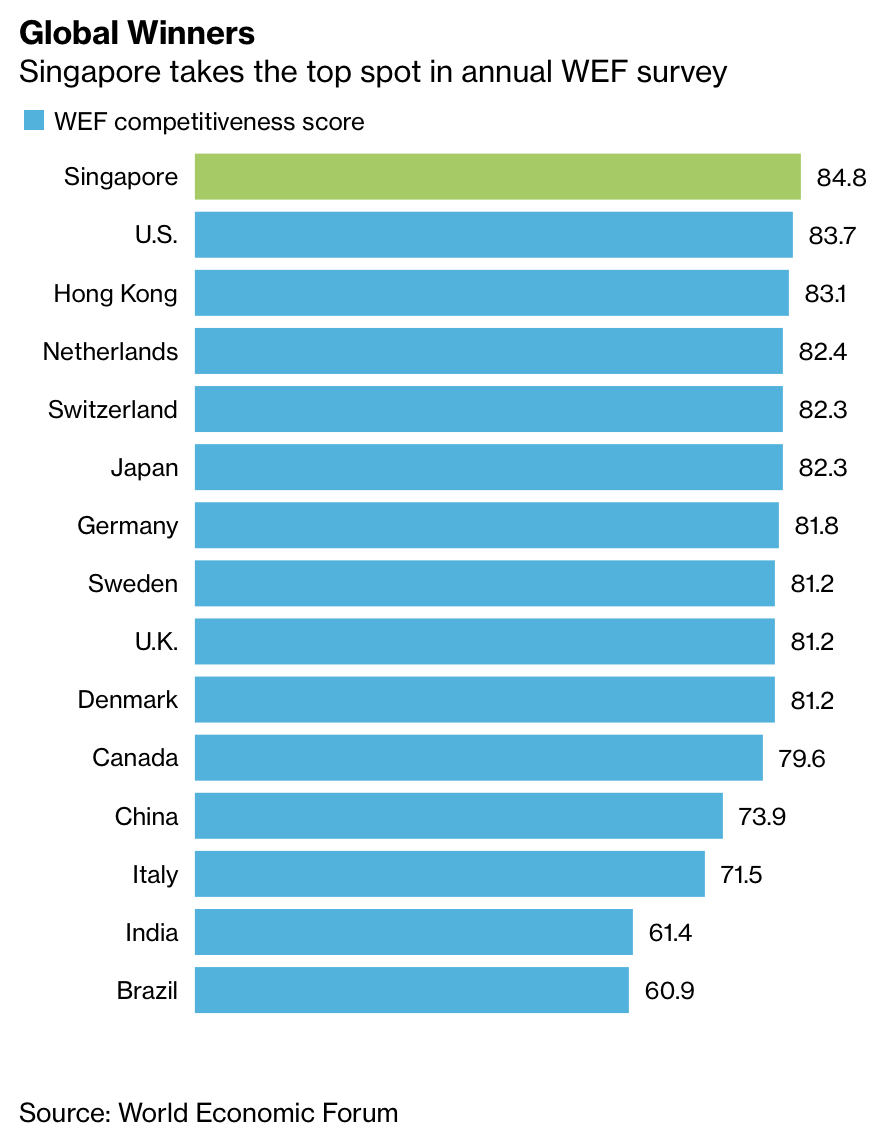
World Economic Forum U.S. Loses Top Spot to Singapore in Competitiveness Rankings
The U.S. dropped from the top spot in the World Economic Forum’s annual competitiveness report, losing out to Singapore. Hong Kong, the Netherlands and Switzerland made up the rest of the top five. Also in the top 10 were Japan, Germany, Sweden, the U.K. and Denmark. Canada and France were ranked 14th and 15th respectively, while China was in 28th place.
On the U.S., the WEF noted growing uncertainty among business leaders and said trade openness has declined. While the U.S. drops down to second in the survey of 141 countries, the WEF said it remains an “innovation powerhouse,” ranking first in business dynamism and second on innovation capability.
Read the full article from Bloomberg + |
 |
|
|
|
|
|
|
|
|
|
|
|
ABOUT THE DIBS AND MCALINDEN RESEARCH PARTNERS
McAlinden Research Partners (MRP) publishes daily and other periodic reports on the economy and the markets.
MRP focuses on identifying change in the global economy and offering an investment thesis whenever an opportunity arises that has not yet been recognized by the market. The DIBs are MRP's compilation of articles and data from multiple sources on subjects reflecting change that have potential investment implications for an industry or group of securities. We share these with our clients who may already have or may be considering exposure in the industries affected. The subjects change daily and constitute an excellent update on featured topics. |
|
|
The information provided in this Report is not to be reproduced or distributed to any other persons. This report has been prepared solely for informational purposes and is not an offer to buy/sell/endorse or a solicitation of an offer to buy/sell/endorse Interests or any other security or instrument or to participate in any trading or investment strategy. No representation or warranty (express or implied) is made or can be given with respect to the sequence, accuracy, completeness, or timeliness of the information in this Report. Unless otherwise noted, all information is sourced from public data.
McAlinden Research Partners is a division of Catalpa Capital Advisors, LLC (CCA), a Registered Investment Advisor. References to specific securities, asset classes and financial markets discussed herein are for illustrative purposes only and should not be interpreted as recommendations to purchase or sell such securities. CCA, MRP, employees and direct affiliates of the firm may or may not own any of the securities mentioned in the report at the time of publication. |
|
|
|
|
|
|
|
|